



CSI Collaborative Research
The Canadian Sugar Institute is committed to maintaining responsible and transparent processes in all its activities, including engagements and partnerships with interested health professionals and scientific bodies on relevant research, education, and communications projects. We aim to adhere to the guiding principles laid out in the publication “Achieving a transparent, actionable framework for public-private partnerships for food and nutrition research” (Alexander et al., 2015).
CSI works collaboratively with external experts and researchers while maintaining transparency and scientific rigor. We participate in collaborative research projects that contribute to the understanding of sugars consumption trends in Canada, sugars-related claims and reformulation in the Canadian marketplace, and knowledge and perceptions regarding sugars. All CSI-funded research projects will be published in peer-reviewed journals with open access. CSI conducts collaborative research on the following topics:
- Sugars Consumption in Canada
- Sugars-Related Claims and Reformulation
- Knowledge and Perceptions Regarding Sugars
- Nutrition Education Resource Development
Sugars Consumption in Canada
The Association Between Added Sugars Intake and the Health y Eating Food Index 2019 Among Canadians: Analyses from the 2015 Canadian Community Health Survey—Nutrition Public Use Microdata File
F. Wang, Z. Fan, S. Marsden, C. DiAngelo, L. Chiavaroli, M. Ahmed, M. Chung. Nutrients. 2026;18(5):2570
Key findings:
- The association between added sugars intake and HEFI scores was negative but non-linear.
- There were large variations in HEFI scores among individuals with similar added sugars intakes, suggesting that added sugars alone may not fully capture overall diet quality or adherence to Canada’s Food Guide.
- Among high added sugars consumers (>15% EI), lower HEFI scores were largely due to higher proportions of sweetened beverages (i.e., low beverage scores) and lower intakes of vegetables and fruit and plant-based proteins.
- Scores for protein food and whole grains were low across all added sugars intake categories.
Preliminary findings presented at:
Preliminary findings published in:
The association between added sugars intake and key nutr ient inadequacy among Canadian adults: Analyses from the Canadian Community Health Survey – Nutrition 2015 Public Use Microdata File
F. Wang, L. Ricciuto, V. Fulgoni III, L. DiFrancesco, D. Kitts, L. Chiavaroli, M. Ahmed, J. Sievenpiper.
Key Findings:
- Added sugars intakes (% kcal/d) ranged from <1.3% (decile 1, <4.6g/d) to >18.3% (decile 10, >93.3 g/d) with a median intake of 6.8% kcal/d (28.5 g/d).
- Significant inverse associations between added sugars intake deciles and % <EAR were found for calcium, magnesium, and zinc in all adults (p<0.01). In adults aged 71+ years, such inverse associations were also observed for iron, folate, riboflavin, thiamin, and vitamin B6.
- Adjusting for energy intakes attenuated the association for calcium but strengthened the association for zinc and rendered the association for magnesium non-significant.
- The relationships for calcium, magnesium and zinc in all adults remained significant after removing the lowest and highest deciles of added sugars intakes (deciles 1 and 10).
Preliminary findings presented at:
- Canadian Foundation for Dietetic Research Showcase (virtual; March 4, 2026)
- Canadian Nutrition Society Annual Conference (Montreal, QC; May 8-10, 2025)
Preliminary abstract published in:
- Canadian Journal of Dietetic Practice and Reseach. 2026; e-First
- Applied Physiology, Nutrition and Metabolism. 2025; S20-21.
Association Between Added Sugars Intake and the Healthy Eating Index-2015 among Canadian Children—Analyses from the Canadian Community Health Survey – Nutrition 2015 Public Use Microdata File
 F. Wang, L. Chiavaroli, A.P. Ng, L. Ricciuto, C. DiAngelo, S. Marsden, J. Sievenpiper. Canadian Journal of Dietetic Practice and Research. 2022;83(4):216.
Key findings:
- There was an inverse association between added sugars intakes and total HEI-2015 scores – the association was non-linear with the greatest reductions in HEI-2015 scores for children at the highest added sugars intakes.
- For children aged 2-8 years, total HEI scores ranged from 60.7 for those with the lowest added sugars intake (quintile 1 or Q1, <4.1% energy from added sugars), to 48.6 for children with the highest added sugars intake (Q5, >14.0% energy from added sugars).
- There was no significant difference in total HEI-2015 scores between children in Q2 to Q4 (with mean added sugars intakes between 4.1 - 14.0% energy).
- Based on the component scores, different dietary patterns were observed for intakes of sodium, saturated fat, dairy foods, and whole grains, suggesting distinctive food choices across different levels of added sugars intake.
Preliminary findings presented at:
Preliminary abstract published in:
Association Between Added Sugars Intake and the Healthy Eating Index-2015 among Canadian Adults—Analyses from the Canadian Community Health Survey – Nutrition 2015 Public Use Microdata File
F. Wang, L. Chiavaroli, A.P. Ng, L. Ricciuto, C. DiAngelo, S. Marsden, J. Sievenpiper..JPG)
Key findings:
- There was an inverse association between added sugars intakes and total HEI-2015 scores – the association was non-linear with the greatest reductions in HEI-2015 scores for adults at higher intakes of added sugars.
- For adults (19 years and older), total HEI scores ranged from 57.5 for those with the lowest added sugars intake (quintile 1 or Q1, <2.8% energy from added sugars), to 43.9 for adults with the highest added sugars intake (Q5, >14.0% energy from added sugars).
- Reductions in total HEI and component scores for vegetables, fruit, and protein intakes were more prominent for those with the highest intakes of added sugars.
- Based on the component scores, different dietary patterns were observed for intakes of sodium, saturated fat, fatty acid rations, dairy foods, and whole grains, suggesting distinctive food choices across different levels of added sugars intake.
Preliminary findings presented at:
Intakes of Nutrients and Food Categories in Canadian Children and Adolescents Across Levels of Sugars Intake: Cross-sectional Analyses of the Canadian Community Health Survey 2015 Public Use Microdata File
Chiavaroli L, Wang Y(F), Ahmed M, Ng A(P), DiAngelo C, Marsden S, Sievenpiper JL. Applied Physiology, Nutrition and Metabolism. 2022 April;47(4):415-428.
Key findings:
- Canadian children and adolescents with lower sugars intake had better intakes of some nutrients.
- Energy intakes did not differ across sugars intake.
- Older adolescents with mean intakes of total sugars had better intakes of some key nutrients (potassium, calcium, fibre).
Preliminary findings presented at:
- 2021 Canadian Nutrition Society Annual Conference (virtual), April 29-30 & May 6-7, 2021
- 2021 Dietitians of Canada National Conference (virtual), May 5-June 30, 2021
Preliminary abstract published in:
- Applied Physiology, Nutrition and Metabolism, 2021, 46(4(Suppl 1)):S6.
- Canadian Journal of Dietetic Practice and Research, 2021, 82(3):152.
Canadian Adults with Moderate Intakes of Total Sugars have Greater Intakes of Fibre and Key Micronutrients: Results from the Canadian Community Health Survey 2015 Public Use Microdata File
Wang Y(F), Chiavaroli L, Roke K, DiAngelo C, Marsden S, Sievenpiper J. Nutrients. 2020;12(4):1124.
Key findings:
- Canadian adults consumed on average 18.8 % energy from total sugars, 9.9 % energy from free sugars, and 8.6 % energy from added sugars.
- Canadian adults with a moderate intake of total sugars had greater intakes of dietary fibre and key micronutrients such as calcium, vitamin D and potassium compared to those with high and low intakes of total sugars, primarily due to different intakes of fruits, milk, and yogurt.
- There was an inverse relationship between total sugars and total fat intakes as a % energy across quintiles, which mirrors the “sugar-fat seesaw” phenomenon. This reciprocal relationship was also observed for saturated fat as a % energy.
Preliminary findings presented at:
- 2020 Canadian Nutrition Society Virtual Poster Expo (May 7-15, 2020)
- 2020 Dietitians of Canada National Conference (virtual), May 27 - July 29, 2020
Preliminary abstract published in:
- Applied Physiology, Nutrition and Metabolism, 2020, 45(4(Suppl 1)):S52.
- Canadian Journal of Dietetic Practice and Research, 2020, 81(3):158.
 Trends in Loss-Adjusted Availability of Added Sugars and Energy Contribution from Macronutrients and Major Food Groups in Canada and the United States
Wang Y(F), Marsden S, Chiavaroli L, DiAngelo C, Sievenpiper JL. Journal of the American Nutrition Association. 2022 June; DOI: 10.1080/07315724.2022.2073923.
Key findings:
- There was a 17% decline in loss-adjusted per capita consumption of added sugars in Canada over the twenty-year period from 1999 to 2019. This was largely attributed to reduced intakes of refined sugar and sugars in soft drinks.
- Added sugars intake in Canada was generally 30% less than that in the US.
- There was a consistent decline in total energy intake and % energy from carbohydrates, accompanied by increased % energy from fats, particularly in the last 10 years.
- Absolute intakes (kcal/day) of food categories such as “fats and oils”, “meat, eggs, and nuts”, “flour and cereal products” also declined and remain below 1999 levels, but have shown an increasing trend in more recent years, suggesting a shift in consumer food choices.
Estimated Intakes and Sources of Total and Added Sugars in the Canadian Diet
Brisbois TD, Marsden SL, Anderson GH, Sievenpiper JL. Nutrients. 2014;6(5):1899-1912.
Key findings:
- Analysis of both survey and availability data suggests that added sugars average 11%–13% of total energy intake.
- Availability data indicate that added sugars intakes have been stable or modestly declining as a percent of total energy over the past three decades.
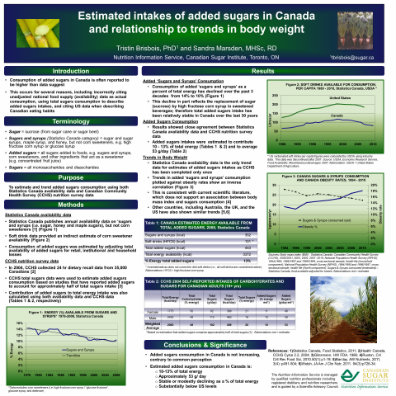
Estimated intakes of added sugars in Canada and relationship to trends in body weight.
Brisbois TD, Marsden SL. Canadian Journal of Diabetes. 2012;36(S5):S66.
Presented at
- Canadian Diabetes Association / Canadian Society of Endocrinology and Metabolism Professional Conference in Vancouver, BC (October 10-13, 2012)
- Canadian Nutrition Society Annual Meeting In Vancouver, BC (May 23-25, 2012)
Sugars Claims and Reformulation
Disconnection between sugars reduction and calorie reduction in baked goods and breakfast  cereals with sugars-related nutrient content claims in the Canadian marketplace
Wang YF, Marsden S, Diangelo C, Clarke A, Chung A, Yu J, Fan Z, Cooper J, Kitts D. Front Nutr. 2025;12:1539695.
Key findings:
- Despite reductions in sugars, there was no significant difference in Calorie content between claims products compared to non-reformulated reference products.
- 49% of “no added sugars” products, 27% of "sugar-free" products, and 23% of "lower/reduced in sugar" products had higher Calories than their reference products.
- “Unsweetened" baked goods had significantly more Calories due to higher fat content.
- Sugar alcohols, dietary fibres, non-nutritive sweeteners and starch were the most common substitutes for added sugars in claim products.
Lack of calorie reduction in bakery products with sugars-related nutrient content claims in the Canadian marketplace
Preliminary abstract presented at:
- Canadian Institute for Food Science and Technology Food Summit in London, ON (June 7-9, 2023)
- Canadian Nutrition Society Annual Conference in Quebec City, QC (May 6-7, 2023)
Lack of calorie reduction in breakfast cereals with sugars-related nutrient content claims in the Canadian marketplace
Preliminary abstract presented at: 
Knowledge and Perceptions Regarding Sugars
Understanding carbohydrates and sugars: Assessing knowledge and perceptions among university students in Canada
F. Wang, N. Bellissimo, D. Kitts, Z. Fan, D. Ma, B. Luhovyy, S. Cheema, D. Vine, S. Proctor, K. Power, T. Cohen, C. Couillard, S. Pomerleau, C. O'Connor, L. Chiavaroli, M. Suh.
Key Findings:
- Beyond course materials, the top three sources where participants obtained nutrition information were academic journals, government materials, and health association materials.
- A gap in glycemia-related knowledge was shown, with only 33.5% correctly selecting “white bread” as having the highest glycemic index from a provided list of foods, and a higher percentage (44%) incorrectly chose “table sugar”.
- Only 25.9% of respondents were able to identify correct statements related to glycemic index and glycemic response.
- A higher proportion of students majoring in Nutrition or Dietetics correctly answered many basic carbohydrate knowledge questions compared to students in other majors, except questions about glycemic index and dental caries.
- In contrast, there were no differences in the accuracy rates between majors on basic sugar knowledge questions. Perceptions of sugars were generally negative, with a higher proportion of students having opinions aligned with common media messages around sugars in the diet.
Preliminary abstract presented at:
Preliminary abstract published in:

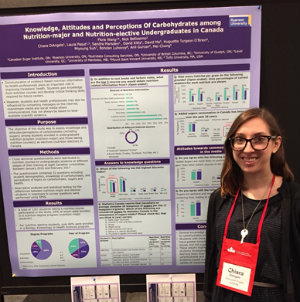
Knowledge, attitudes and perceptions of carbohydrates among nutrition-major and nutrition-elective undergraduates in Canada
Wang Y(F), Bellissimo N, Kitts DD, Turgeon O'Brien H, Ma WLD, Suh M, Luhovyy B, DiAngelo C, Pasut L, Marsden S, Chung M, Gurcan A. Journal of the American College of Nutrition. 2020;40(2):164-171.
Key findings:
- Internet-based sources accounted for one-third of the sources where students obtained nutrition information; academic sources ranked second at approximately 27%.
- Students who indicated more credible sources where they obtained nutrition information had a higher number of carbohydrate-related knowledge questions answered correctly; no difference was observed for sugars-related knowledge questions.
- A higher percentage of nutrition-majors correctly answered knowledge questions related to carbohydrates compared to nutrition-elective students; no difference was observed between the two groups for sugars-related knowledge questions.
- Perceptions and attitudes towards sugars were generally negative and did not differ between nutrition-major and nutrition-elective students.
Preliminary abstract published in:
Preliminary abstract presented at:
- Canadian Nutrition Society Annual Meeting in Halifax, NS (May 3-5, 2018)
- Dietitians of Canada National Conference in St. John's, NL (June 2017)
- Canadian Nutrition Society Annual Meeting in Montreal, QC (May 25-27, 2017)
Knowledge of sugars consumption and the WHO sugars guideline among Canadian dietitians and other health professionals
Wang F, DiAngelo CL, Marsden SL, Pasut L, Kitts D. Bellissimo N. Canadian Journal of Dietetic Practice and Research. 2020;81(3):142-145.
Key findings:
- Knowledge gaps existed among surveyed Canadian health professionals on topics related to sugars consumption and the WHO sugars guideline.
- Future research should focus on tools to support better communication of sugars guideline and consistent use of sugars terminology.
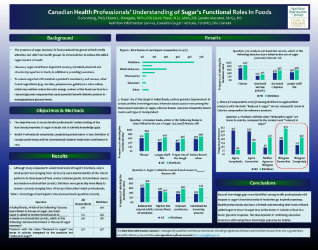
Canadian health professionals' understanding of sugar's functional roles in foods.
(Abstract Only) Published in:
- Canadian Journal of Diabetes, 2016;40(5 (Suppl 1)):S53.
- Canadian Foundation for Dietetic Research website
Presented at
- Canadian Diabetes Association/ Canadian Society of Endocrinology and Metabolism Professional Conference in Ottawa, ON (October 26-29. 2016)
- Dietitians of Canada National Conference in Winnipeg, MB (June 8-11, 2016)
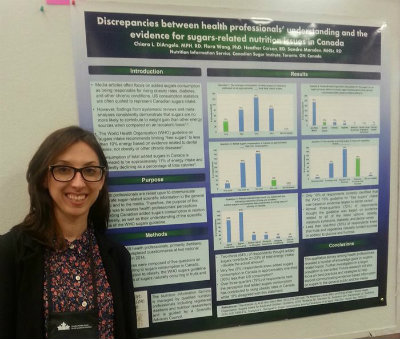
Discrepancies between health professionals' understanding and the evidence for sugars-related nutrition issues in Canada.
(Abstract Only) Published in
- Applied Physiology, Nutrition and Metabolism, 2015;40(5):508.
- Canadian Foundation for Dietetic Research website
Presented at
- Dietitians of Canada National Conference in Quebec City, QC (June 4-6, 2015)
- Canadian Nutrition Society Annual Meeting in Winnipeg, MB (May 28-30, 3015)
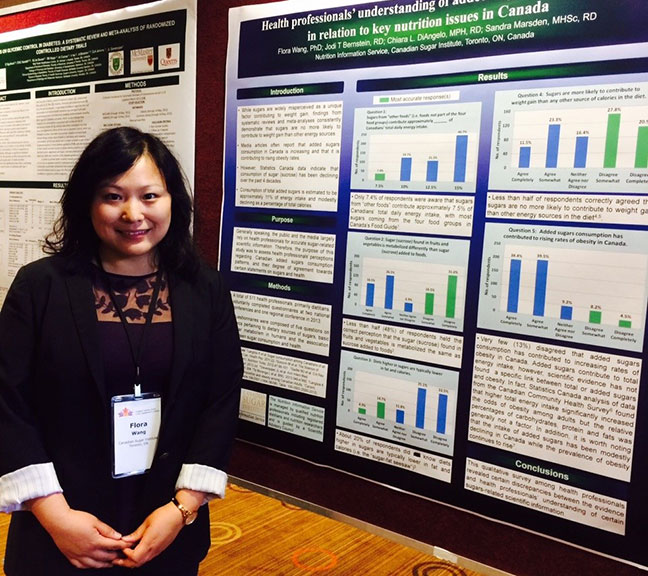
Health professionals' understanding of added sugars consumption in relation to key nutrition issues in Canada.
(Abstract Only) Published in
- Canadian Journal of Diabetes, 2014;38(5 Suppl):S232.
- Applied Physiology, Nutrition and Metabolism, 2014;39(5):640-641.
- Canadian Foundation for Dietetic Research website
Presented at
- Canadian Diabetes Association / Professional Conference in Winnipeg, MB (October 22-25, 2014)
- Dietitians of Canada National Conference in Ottawa, ON (June 12-14, 2014)
- Canadian Nutrition Society Annual Meeting in St. John's, NL (June 5-7, 2014)

Sugar claims on foods: health professionals' understanding compared to marketplace practice.
(Abstract Only) Published in
- Canadian Journal of Diabetes, 2013;37(S4):S71.
- Canadian Foundation for Dietetic Research website
- Applied Physiology, Nutrition and Metabolism, 2013;28(4):433-476.
Presented at
- Vascular 2013 conference in Montreal, QC (October 17, 2013)
- Dietitians of Canada National Conference in Victoria, BC (June 14, 2013)
- Canadian Nutrition Society Annual Meeting in Quebec City, QC (May 30-June 2, 2013)
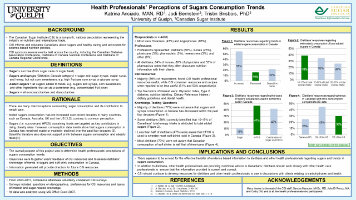
Health Professionals' perceptions of sugars consumption trends
(Abstract Only) Published in
Presented at
Nutrition Education Resource Development.png)
Enhancing nutrition education resources through the development and refinement of a checklist using the suitability assessment of materials (SAM)
O. Sage, F. Wang, C DiAngelo, S. Marsen, C. Faustini, S. Grant, T. Cohen. Nutr Health. 2026 Jan;32(1):31-40.
Key Findings:
- SAM-scores significantly improved in both resources by the third round.
- The mean score from the first survey was 2.36 ± 0.21 (adequate). Scores were adequate or superior for all categories except Learning, Stimulation &Motivation (1.96 ± 0.11). After refinements, the mean score from the second survey was 2.5 ± 0.09 (superior).
- The refined checklist included more explicit instructions and provided examples to help guide resource changes.
Presented at:
- International Congress of Nutrition and Dietetics (Toronto, ON; June 12-14, 2024)
Abstract published in:
Additional Presentations at Health Professional Conferences
- CSI Presented Research at CIFST in Burnaby, BC (February 22-23, 2016)
- Symposium at 2013 Canadian Nutrition Society Annual Meeting "Nutrition Misconceptions - The role of the media and the researchers: Sugar - a case study"
- CSI presented at the Student & Trainee Symposium at the 2013 Canadian Nutrition Society Annual Meeting


