


What's New
Whats New
Updates on estimated added sugars consumption in Canada
On May 31, 2021, Statistics Canada released loss-adjusted food availability data for 2020 (CANSIM), including updated data on sugars, syrups, and soft drinks, which is collected annually. This data can be used to estimate the availability of added sugars in Canada and serves as a proxy to monitor trends in per capita (per person) added sugars consumption in Canada.
- The estimated per capita added sugars1 consumption in Canada is estimated at 11% of energy intake in 2020 (see graph below).
- This reflects a continuing long-term declining trend in estimated average added sugars consumption in Canada, with a 15% per capita reduction based on % energy over the past 20 years (decline from 13% energy in 2000 to 11% energy in 2020).
- The largest contributor to the decline in added sugars is the continued decline in soft drinks availability, which is down by 53% compared with 2000.
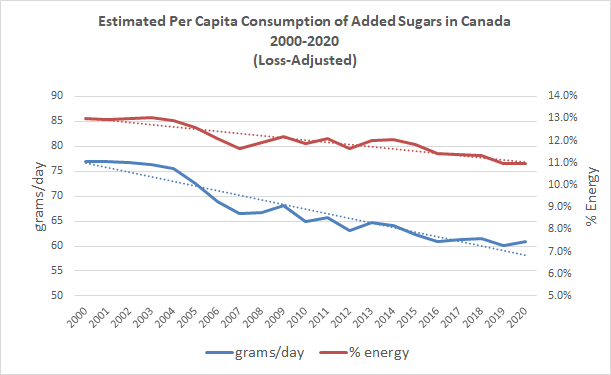
1Total added sugars estimated from Statistics Canada data on refined sugar, maple sugar, honey and soft drinks (estimated sugars content).
New Infographic Available for Download: Sugars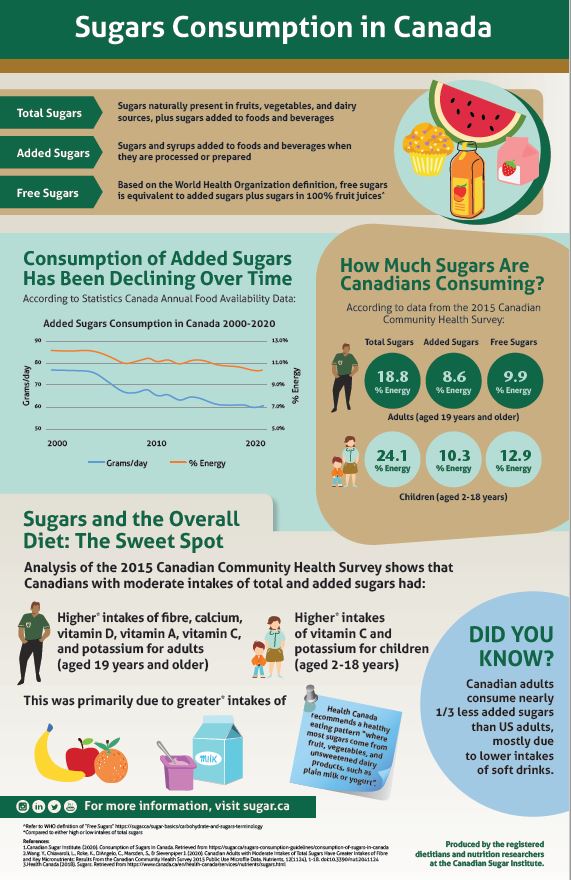
Consumption in Canada
For more information, CSI’s latest infographic “Sugars Consumption in Canada” combines the most recent added sugars availability data with information from analysis of Canadian Community Health Survey sugars consumption data for adults and children. It is available to download from our website.
Additional Resources:
- Consumption of Sugars in Canada
- Wang YF, Chiavaroli L, Roke K, DiAngelo C, Marsden S, Sievenpiper J. Canadian Adults with Moderate Intakes of Total Sugars have Greater Intakes of Fibre and Key Micronutrients: Results from the Canadian Community Health Survey 2015 Public Use Microdata File. Nutrients. 2020 Apr 17;12(4):E1124.
- A review of sugar consumption from nationally representative dietary surveys across the world