


What's New
Whats New
Statistics Canada Revises Sugar Consumption Data
Estimated Consumption of Sugars and Syrups in Canada
The most recent publication of Food Statistics (Statistics Canada, November 2005) shows that estimated consumption of sugars and syrups (refined sugar, maple sugar and honey) has been decreasing over the past decade. These consumption estimates are derived from data on sugar and syrups "available for consumption" 1 by deducting estimated losses; i.e. retail, household, cooking and plate loss.
This publication includes revisions from previously published data to correct certain methodological errors and to account for the large growth in exports of sugar in food products that are not consumed in Canada. Statistics Canada’s previous data suggested an increased intake of sugars and syrups during this time. In fact, sugars and syrups disappearance decreased by 15% between 1994 and 2004 (See Figure 1 below).
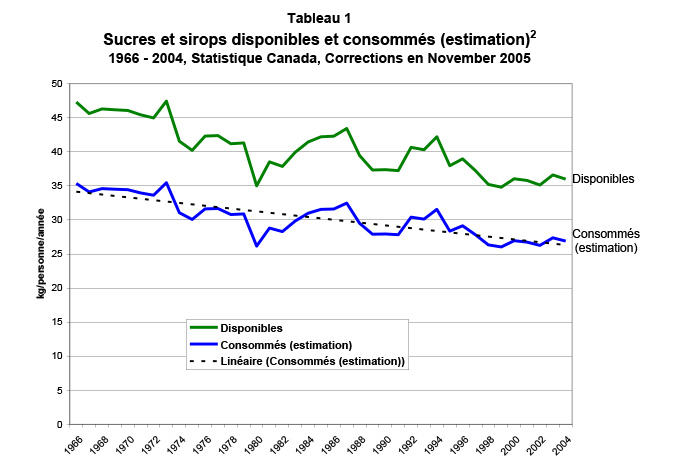
The availability (disappearance) of sugars and syrups in Canada reflects the total amount of these commodities entering the market, regardless of their final use. The data are collected from producers and manufacturers using techniques that vary by commodity. This provides a basis for examining food consumption changes over time (trends) without the problems implicit in consumer survey data. If waste and other losses in the system are relatively constant over time, these data provide a measure of changes in consumption patterns that is independent of and complements consumer survey data.
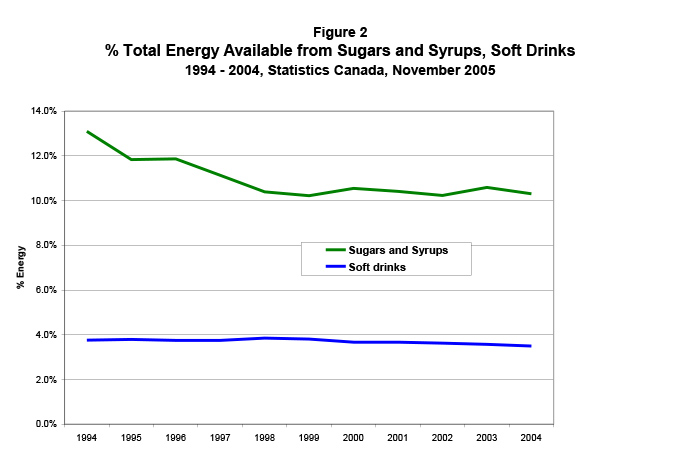
Sugar and Syrups Contribute 10.3% of Total Available Energy
In 2004, sugars and syrups contributed 10.3% of the total available energy, per person, in the Canadian food supply. This represents a decrease from 13.1% in 1994. It should be noted that sugars and syrups do not include high fructose corn syrup which is the principal sweetener in caloric soft drinks. Estimated energy available from soft drinks has remained relatively stable over the same time period. (See Figure 2 below)
Notes:
- Food available for consumption: Statistics Canada tables provide data on the supply and use of food commodities, representing "food that is available for consumption", not accounting for losses in stores, households, private institutions or restaurants. Food available for consumption (also known as disappearance) is determined as follows:
- Beginning stocks, production and imports are summed to derive total supply,
- Net supply is calculated by deducting exports, manufacturing uses, feed, waste and ending stocks,
- The net supply is divided by the Canadian population as of July 1 to obtain disappearance per person (per capita).
- Food consumed: Estimated quantities of "food consumed" are calculated based on food availability less estimated losses including retail, household, cooking and plate loss. Statistics Canada advises that these adjustments to estimate food consumed are experimental and should be used with caution.
Source: Statistics Canada Food Stats 2004, Vol. 4, No. 2, Statistics Canada, November 2005.