North American Trade
Export markets are critical for Canadian sugar and processed foods containing sugar. Efficient sugar production, based on world market sugar pricing, has resulted in the development of a vibrant value-added food processing sector in Canada. Canada’s sugar industry depends on food processors for 80% of sugar sales and food processors in turn depend on Canada’s local supply of high quality, competitively priced sugar.
The United States is, by far, the most important market for Canada’s sugar and sugar-containing products (SCPs) exports. Canada can supply the U.S. with high-quality SCPs, from certified production facilities on a just-in-time basis. The U.S. similarly depends on Canada as the key destination for its exports.
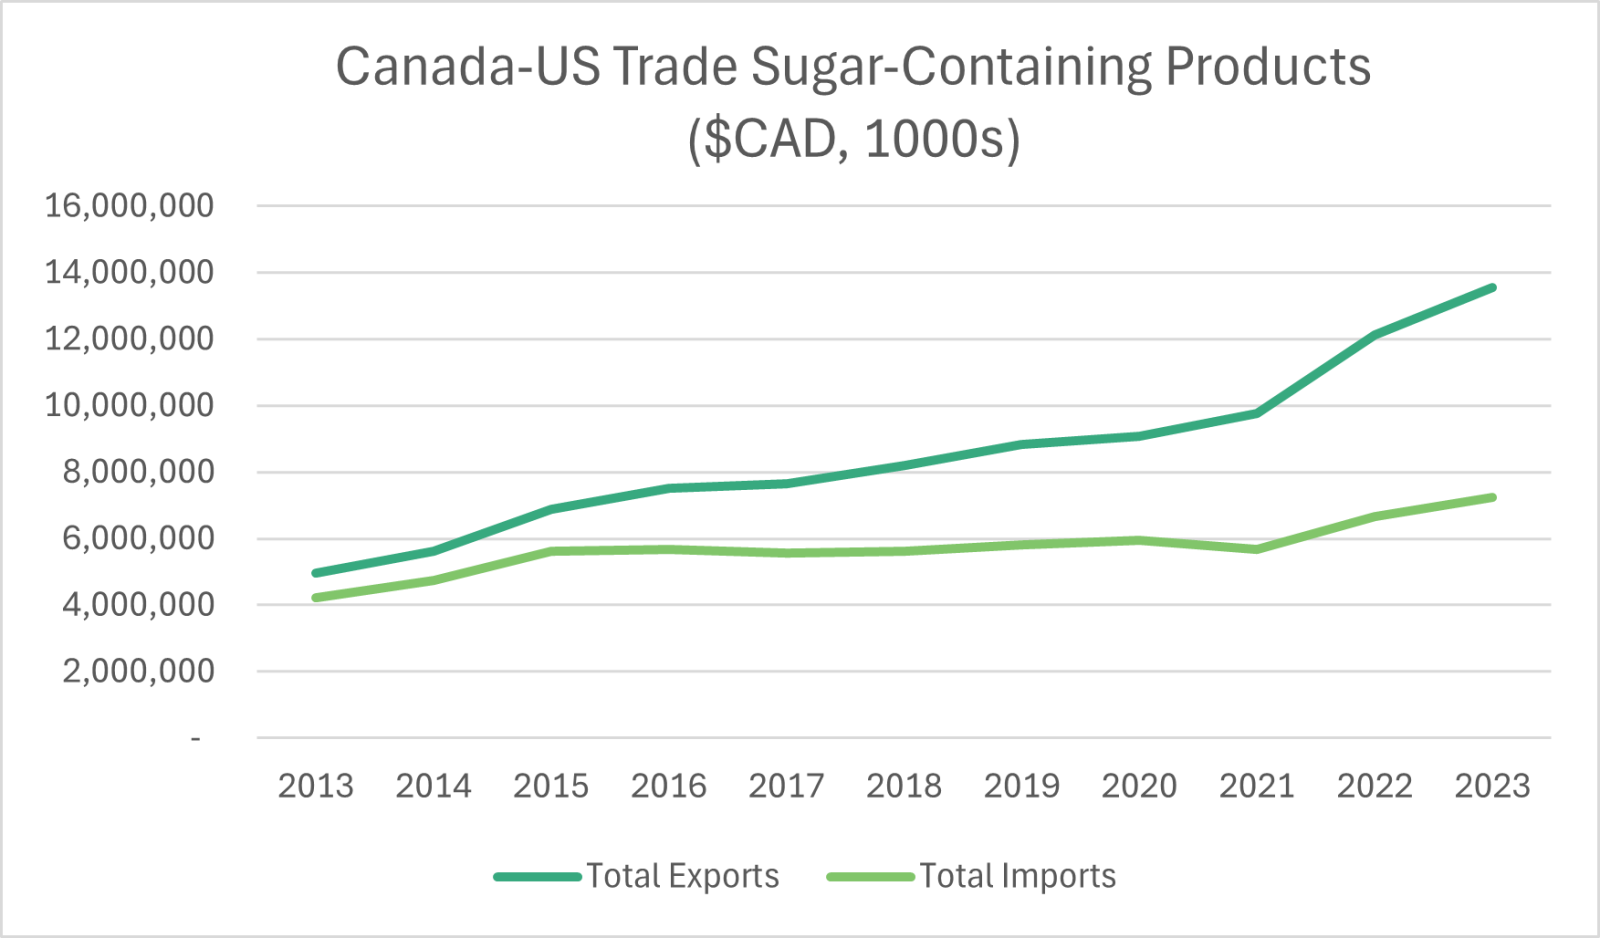
The majority of sugar-containing foods are freely traded between Canada and the United States with two-way trade valued at $20.8 billion in 2023, up from $9.2 billion in 2013. Based on sugar, other ingredient costs, exchange rate trends and a number of other competitive factors, Canada's trade balance has improved over the past ten years. Overall, Canada-U.S. trade in SCPs is complementary – producers and consumers in both countries have benefitted. Canada’s exports of SCPs to the United States represent about 5% of the value of total U.S. agri-food imports, while U.S. exports of SCPs to Canada represent about 12% of the value of total Canadian agri-food imports.
Canada-U.S.-Mexico Agreement (CUSMA)
The North American Free Trade Agreement (NAFTA) was implemented in 1994 and provided for gradual free trade in sugar between the United States and Mexico. In fact, Mexico achieved full duty-free access to the U.S. in 2008. Canada was excluded from the NAFTA sugar agreement so Canadian sugar exports continued to be limited to one-tenth of one percent (0.1%) of the U.S. sugar market. Canada also continued to face quota limitations on a wide range of sugar-containing products while Mexico's access has been unlimited since 2003.
On July 1, 2020, the new Canada-United States-Mexico Agreement (CUSMA) entered into force. CUSMA is referred to as USMCA by the United States and T-MEC by Mexico. The CUSMA preserved the existing sugar and sugar-containing product (SCP) provisions between Canada, the U.S., and Mexico, and added new access to the U.S. for Canadian sugar and SCPs.
The CUSMA agreement includes the historical Canada-specific shares of U.S. WTO tariff rate quotas (TROs) - see U.S. Sugar Policy below. This includes 10,300 tonnes beet sugar and 59,250 tonnes SCPs. These shares were specified in a 1997 Canada-U.S. bilateral understanding. The provisions of this bilateral understanding were incorporated into the CUSMA agreement.
The CUSMA added two new quotas providing an increase in U.S. access for Canadian beet sugar as well as an increase for Canadian SCPs, i.e. 9,600 tonnes of beet sugar and 9,600 tonnes of SCPs on an annual (calendar year) basis. The additional SCP access has a wider range of products and more flexible rules than the WTO quota to ensure the quota is more fully utilized, i.e., all products produced in Canada from cane sugar "refined in Canada" can be shipped to U.S. retail, food service or food processing establishments.
When the U.S. market requires additional imports of refined sugar, the CUSMA provides Canada with a 20% share of any increase in the U.S. WTO refined sugar TRQ. This additional sugar can be supplied from Canadian beet sugar or raw cane sugar "refined in Canada". There has been just one increase in the U.S. WTO refined sugar TRQ since the agreement was implemented. See: Additional Tariff-Rate Quota Volume for Refined Sugar From Canada Under the USMCA - July 1, 2020.
Canadian exports of refined beet and cane sugar as well as SCPs under these provisions must obtain a Canadian export permit from the Government of Canada as controlled under Canada's Export and Import Permits Act (EIPA) and corresponding regulations.
| Quota | Quota Period | Quantity (MT) | Global Affairs Canada export permit notice |
|---|---|---|---|
| WTO Refined Sugar | Oct 1 - Sep 30 | 10,300 | Exports of Refined Sugar to the U.S. under WTO Commitments - Serial No. 1059 |
| CUSMA Refined Sugar | Jan 1 - Dec 31 | 9,600 | Sugar for Export to the U.S. under CUSMA - Serial No. 1035 |
| WTO Sugar-Containing Products | Oct 1 - Sep 30 | 59,250 | Sugar-containing Products for Export to the U.S. (WTO) - Serial No. 1091 |
| CUSMA Sugar-Containing Products | Jan 1 - Dec 31 | 9,600 | Sugar-containing Products for Export to the U.S. under CUSMA - Serial No. 1034 |
| WTO Refined Sugar Additional Quantity | TBD | 20% | Sugar (Additional Quantity) for Export to the U.S. under CUSMA - Serial No. 1066 |
U.S. Sugar Policy
Unlike Canada’s free market sugar policy, the U.S. government intervenes in its sugar market to support domestic production of cane and beet sugar. The policy supports U.S. domestic sugar prices above world and Canadian price levels, restricts imports and uses a special “re-export program” to encourage exports of sugar and sugar-containing products.
The sugar program uses three tools to ensure that U.S. growers and sugar processors receive a minimum price for their sugar.
- The U.S. Department of Agriculture (USDA) makes loans available to U.S. processors of sugarcane and sugar beets at set loan rates that support the market price above world prices
- “Marketing allotments” are set to limit the amount of sugar that processors can sell in the U.S. market but do not limit the amount of production so the excess must be stored or exported
- Quotas (TRQs) restrict the amount of foreign sugar allowed to enter the U.S. market.
Tariff rate quotas (TRQs) on imports of raw and refined sugar and a number of sugar-containing products continue to limit imports into the United States from all countries except Mexico. TRQs set a fixed volume of access at a low or duty-free rate but limit access above that quota with a much higher, usually prohibitive tariff. Although Mexico has duty-free access to the United States under the USMCA, in 2014 the U.S. International Trade Commission determined that sugar imported from Mexico injured the domestic sugar industry. As a result, Mexico is subject to agreements that suspend U.S. anti-dumping and countervailing duties that would have been applied to Mexican sugar. While these agreements are in place, this sets minimum prices and quantity limits for raw and refined sugar from Mexico.
U.S. global imports of refined sugar are restricted by a very small TRQ of 22,000 tonnes (U.S. fiscal year October 1 - September 30). Canadian refined beet sugar is limited to a 10,300 tonne share of this global TRQ, representing less than 0.1% of the 11.5 million tonne U.S. sugar market. Canadian refined beet and cane sugar can also complete with other global suppliers for a share of the small 7,090 tonne global portion of the TRQ. Any exports of Canadian sugar above these TRQs face the U.S. high tariff rate of $US 357 per tonne. Under the CUSMA, Canada obtained an additional TRQ of 9,600 tonnes beet sugar annually (calendar year).
Canada does not produce raw cane sugar so cannot access the much larger U.S. raw sugar TRQ of 1,117,195 tonnes reserved for preferential cane sugar producing countries. A limited number of countries have also negotiated modest additional TRQs through bilateral trade negotiations (see Regional and Bilateral Trade).
U.S. imports of sugar-containing products that contain more than 10% sugar also face a number of TRQ restrictions. Examples of Canadian products that continue to be restricted include fruit flavoured beverage mixes, cocoa mixes, tea and coffee mixes, flavouring syrups, cake and cookie mixes and doughs, pancake and muffin mixes, dessert mixes and various condiments and seasonings. The CUSMA provides for a small new U.S. TRQ of 9,600 tonnes with more flexible rules to allow access for products made with sugar refined in Canada.
U.S. sugar policy is implemented through its Farm Bill, which is the main agriculture and food policy tool of the federal government. The main provisions of the U.S. sugar program date back to the 1981 Farm Bill. The program has been reauthorized with some changes in subsequent Farm Acts. Under the 2008 Farm Bill, U.S. sugar TRQ import restrictions were continued but with new provisions that make it more difficult for the U.S. government to increase imports at times of short supply. This is particularly the case for U.S. imports of refined sugar, which makes it almost impossible for Canada to increase exports to the U.S. unless there is an "emergency shortage". The 2014 and 2018 Farm Bills did not change these restrictions.
For more information on U.S. sugar policy, visit:
- USDA, Foreign Agricultural Service
- USDA, Economic Research Service
- Sweetener Users Association
- Alliance for Fair Sugar Policy
Canada-U.S. Trade in Refined Sugar
The United States is Canada’s logical export market for the majority of Canada’s agri-food exports. However, unlike other agri-food products, Canadian sugar exports to the United States remain at low levels given quota restrictions (about 4% of Canadian production).
| Year | U.S. | % Canadian Production |
|---|---|---|
| 2019 | 31,616 | 2.4% |
| 2020 | 64,112 | 4.7% |
| 2021 | 68,473 | 4.9% |
| 2022 | 58.011 | 4.2% |
| 2023 | 59,799 | 4.5% |
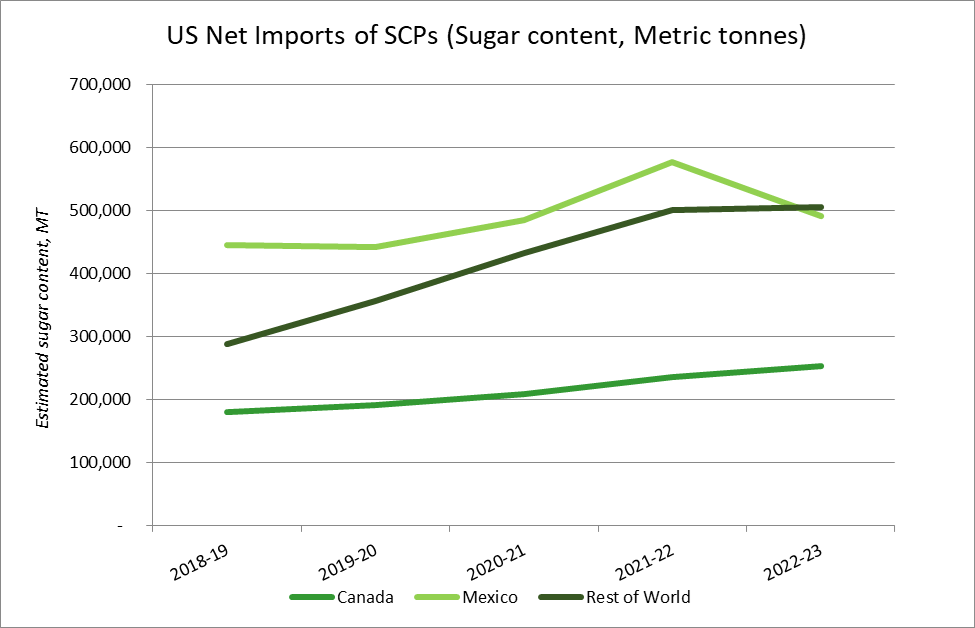
Canada-U.S.-Mexico Trade in Sugar-Containing Products
U.S. imports of SCPs from Mexico have grown at a much faster rate than imports from Canada since 2003 when Mexico was granted duty-free access to the U.S. for all SCPs under the NAFTA. More recently, drought conditions in Mexico have reduced Mexico's exports of sugar and SCPs to the U.S. U.S. imports from other countries have also grown at a faster rate than Canada given free trade agreements negotiated with the U.S. The result has been that U.S. net imports (imports minus exports) from Mexico and other countries has grown more significantly than for Canada.