

What's New
Whats New
Updates on estimated added sugars consumption in Canada
Recent data analysis provides new estimates of sugars consumption in the Canadian population:
- Canadian Community Health Survey (CCHS) 2015 - A study by Wang et al. in Nutrients (2020) provides the first detailed analyses of Canadian adults’ macro- and micro-nutrient intakes stratified by different intakes of total sugars. The study found that Canadian adults consumed on average 18.8 % energy from total sugars, 9.9 % energy from free sugars, and 8.6 % energy from added sugars.
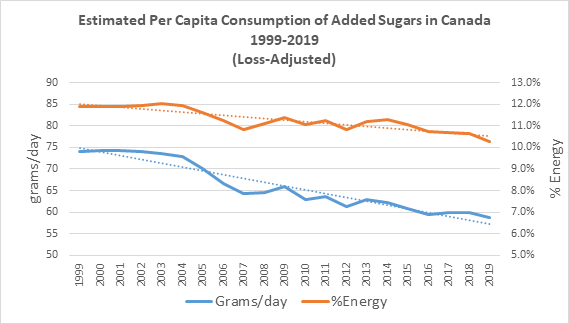
- Statistics Canada - Loss-adjusted food availability data (2019), released on May 28, 2020, provides updated data on sugars, syrups, and soft drinks collected annually by Statistics Canada. This can be used as a proxy to monitor and estimate trends in per capita consumption of added sugars in Canada:
- The loss-adjusted per capita (per person) added sugars consumption in Canada was 10.3 % energy in 2019 (see graph below). It is calculated based on the estimated total energy availability using the Canadian Food Statistics Methods provided by Statistics Canada.
- The amount of refined sugar available for consumption continues to decline, down by 6.3% from 2009 and 12.1% from two decades ago. Soft drink availability is down by 36.5% compared with 2009.
Further details are included below with links to the original research data and analysis.
1) Analysis of CCHS 2015 data indicates that,
- Canadian adults consumed on average 18.8 % energy from total sugars, 9.9 % energy from free sugars, and 8.6 % energy from added sugars.
- Canadian adults with a moderate intake of total sugars (Mean = 18.3 % energy) had greater intakes of dietary fibre and key micronutrients such as calcium, vitamin D and potassium compared to those with high (33.3 % energy) and low (7.9 % energy) intakes of total sugars, primarily due to different intakes of fruits, milk, and yogurt.
- There was an inverse relationship between total sugars and total fat intakes as a % energy across quintiles, which mirrors the “sugar-fat seesaw” phenomenon. This reciprocal relationship was also observed for saturated fat as a % energy.
- The % energy from both free sugars and added sugars among Canadian adults was lower in 2015 compared to 2004. However, differences between CCHS 2004 and CCHS 2015 in population demographics (e.g., older age), survey methods and under-reporting status may have influenced these observations (Garriguet et al. 2018).
This analysis was conducted by the researchers and dietitians of the Canadian Sugar Institute in collaboration with researchers from the University of Toronto. Ongoing analyses are assessing intakes of sugars in relation to macro- and micronutrient intakes among Canadian children and adolescents, as well as diet quality across different levels of sugars intake in relation to dietary recommendations using the same CCHS 2015 database.
- To read the full publication, please visit: Wang et al. Nutrients. 2020;12(4):E1124
- The results have been presented at the 2020 Canadian Nutrition Society Virtual Poster Expo. The poster can be viewed here.
2) The most recent Statistics Canada Loss-Adjusted Food Availability data (released on May 28, 2020) indicate that,
- The estimated per capita added sugars consumption in Canada was 10.3 % energy in 2019.
- This reflects a continuing long-term declining trend, with a 14% per capita reduction based on % energy over the past 20 years1.
1 Total added sugars estimated from Statistics Canada data on refined sugar, maple sugar, honey, and soft drinks (estimated sugars content).
Additional Resources
- Consumption of Sugars in Canada
- A review of sugar consumption from nationally representative dietary surveys across the world
- For other CSI collaborative research projects, please visit: CSO Collaborative Research
References:
- 2015 Agriculture and Agri-Food Canada Report.
- Garriguet, D. Accounting for misreporting when comparing energy intake across time in Canada. Health Rep. 2018; 29: 3–12.
- Langlois K, Garriguet D. Change in total sugars consumption among Canadian children and adults. Statistics Canada Health Reports. January 2019.
- Sadler MJ, McNulty H, Gibson S. Sugar-fat seesaw: A systematic review of the evidence. Crit. Rev. Food Sci. Nutr. 2015, 55, 338–356.
- Wang YF, Chiavaroli L, Roke K, DiAngelo C, Marsden S, Sievenpiper J. Canadian Adults with Moderate Intakes of Total Sugars have Greater Intakes of Fibre and Key Micronutrients: Results from the Canadian Community Health Survey 2015 Public Use Microdata File. Nutrients. 2020 Apr 17;12(4):E1124.